We recently launched our web-app for visualising the vowels of the Manchester Voices Corpus. You can access it here. The app is mostly aimed at people with some expertise in linguistics who would like to explore the vowels in our corpus without needing to take acoustic measurements or write any code themselves. It has the functionality to visualise either the midpoints or the full trajectories of >200,000 vowel tokens from people who have spent most of their life in one borough of Greater Manchester, recorded either in our Accent Van or taking part in a map task.
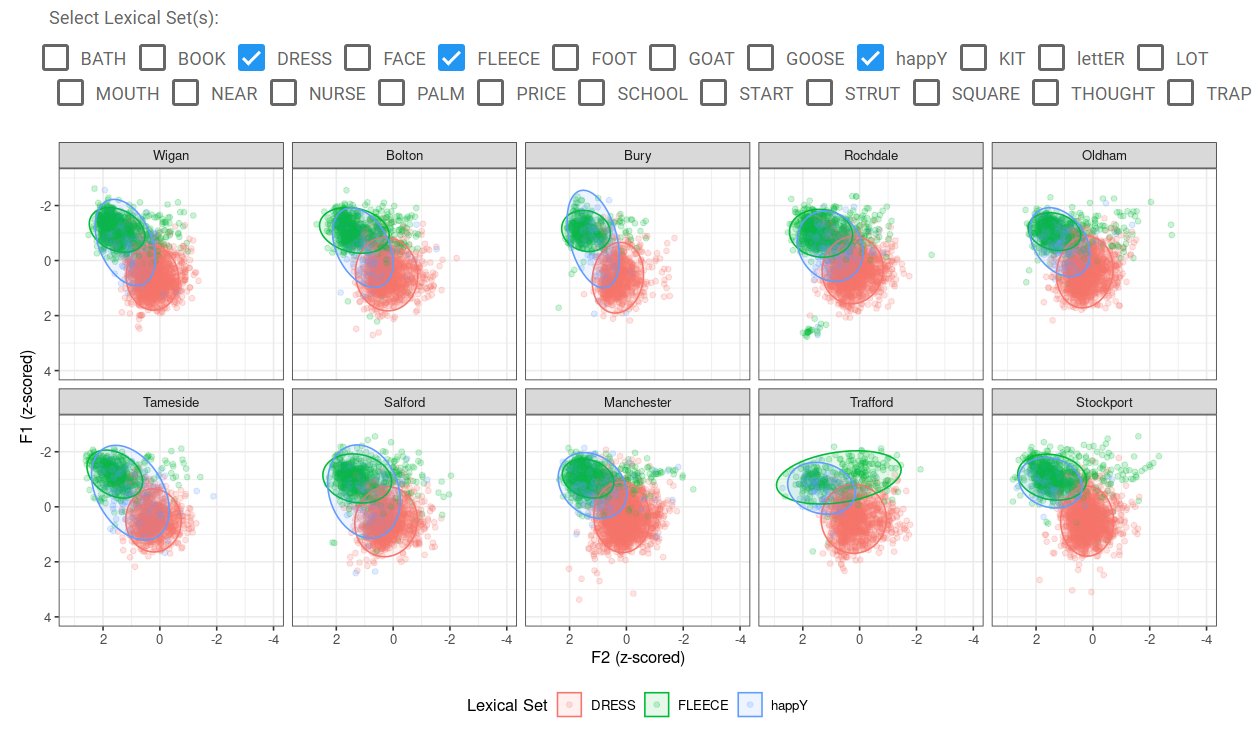
On the Midpoints and Trajectories pages of the app, you can first choose lexical sets to view by Greater Manchester borough. For example, we can visualise FLEECE, DRESS and happY by borough. Notice how the blue happY vowel overlaps more with DRESS in places like Tameside and Salford (i.e., ‘happEH’). In Trafford and Stockport, happY overlaps more with FLEECE (i.e., ‘happEE’).
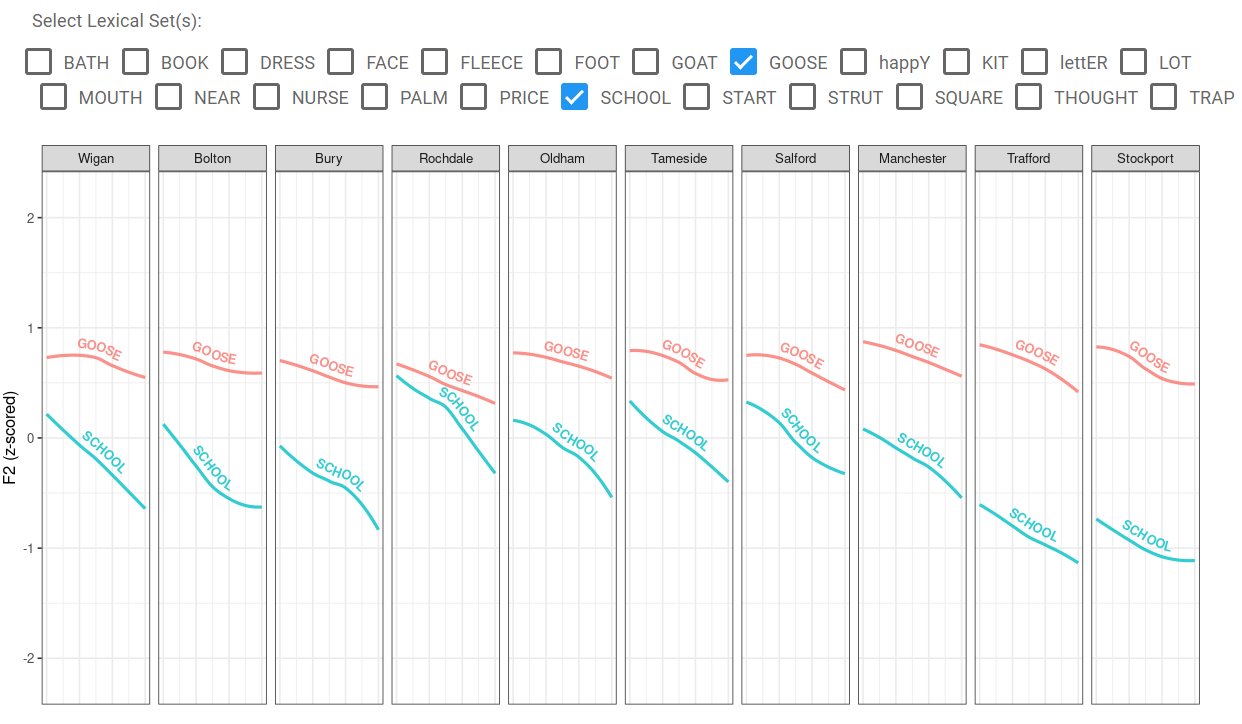
This plot compares the F2 trajectories of SCHOOL (words like ‘school’ and ‘pool’) and GOOSE by borough. The nearer the F2 of SCHOOL is to the F2 of GOOSE, the more likely the pronunciation of SCHOOL as something like ‘skewl’, as you can see in Rochdale.
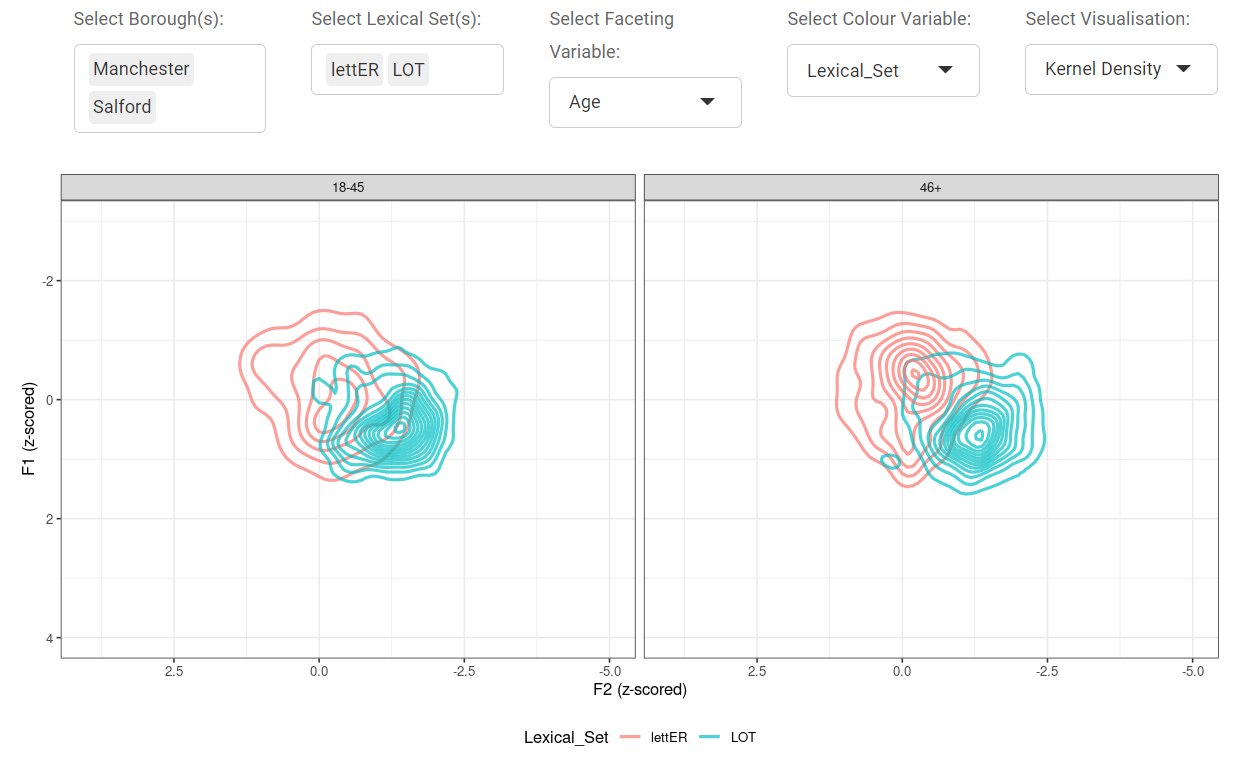
We also have more customisable plots where you can choose which boroughs, vowels and visualisation method (points + ellipses or Kernel density estimation) you would like to use. You can also view variation by age group and gender. For example, this plot compares the overlap of lettER and LOT by age group in Manchester and Salford using Kernel density estimations. You can see that lettER is a bit more backed and lowered in the younger age group (i.e., a little more like ‘lettUH’).
There’s many, many more patterns in this data that can be explored via this app (lots of which we might not have even noticed yet). We hope it will help people to get a detailed picture of vowel variation in Greater Manchester. If you find this app useful, or have any thoughts or suggestions, please drop us a line either on here or at manchester.voices@mmu.ac.uk. Once again, just click here to have a go: https://manchestervoices.shinyapps.io/vowels/